


Business Analytics
Business analytics is the process of collecting, analyzing, and visualizing data that helps businesses make informed decisions based on digital indicators. For modern businesses to be successful, they must be able to properly analyze large volumes of data and extract valuable insights from them.

Have You Encountered This?

Employees tell you that «everything is fine», and to verify the truth, you need to delve into each issue yourself.
Decisions are based on personal feelings, not in the company's best interests.
Calculating indicators takes a lot of time from key employees.
The advertising budget is used irrationally or wasted.
Data is stored in different sources and is only current at the time of calculation.
It's unclear where the weak spot in the company is, and where a problem may arise.
BI Analytics Is:

An independent center of reliable information with key indicators in the form of convenient dashboards.
Well-founded management decisions with the help of a flexible interactive report based on current data collected automatically from various sources.
The ability to easily assess the situation in the company (department) with a couple of clicks, at any time and on one screen. We increase the speed and accuracy of decision-making.

Сервис Digital Office Concierge помогает решить основные проблемы собственников офисных пространств и коворкингов
How Does Business Analytics Work?
The service collects data from various sources, processes it, and provides clear, transparent analytics. You will be able to easily assess the situation in the company, make decisions quickly and accurately, freeing up your personal time.
Ready-Made Solutions for Various Departments and Business Sectors
BI sales department analysis model
Leads and sales
Sales funnel conversion
Average check, sales frequency, and LTV
Filters by periods, products, and managers
Plan vs. actual comparison with the previous period


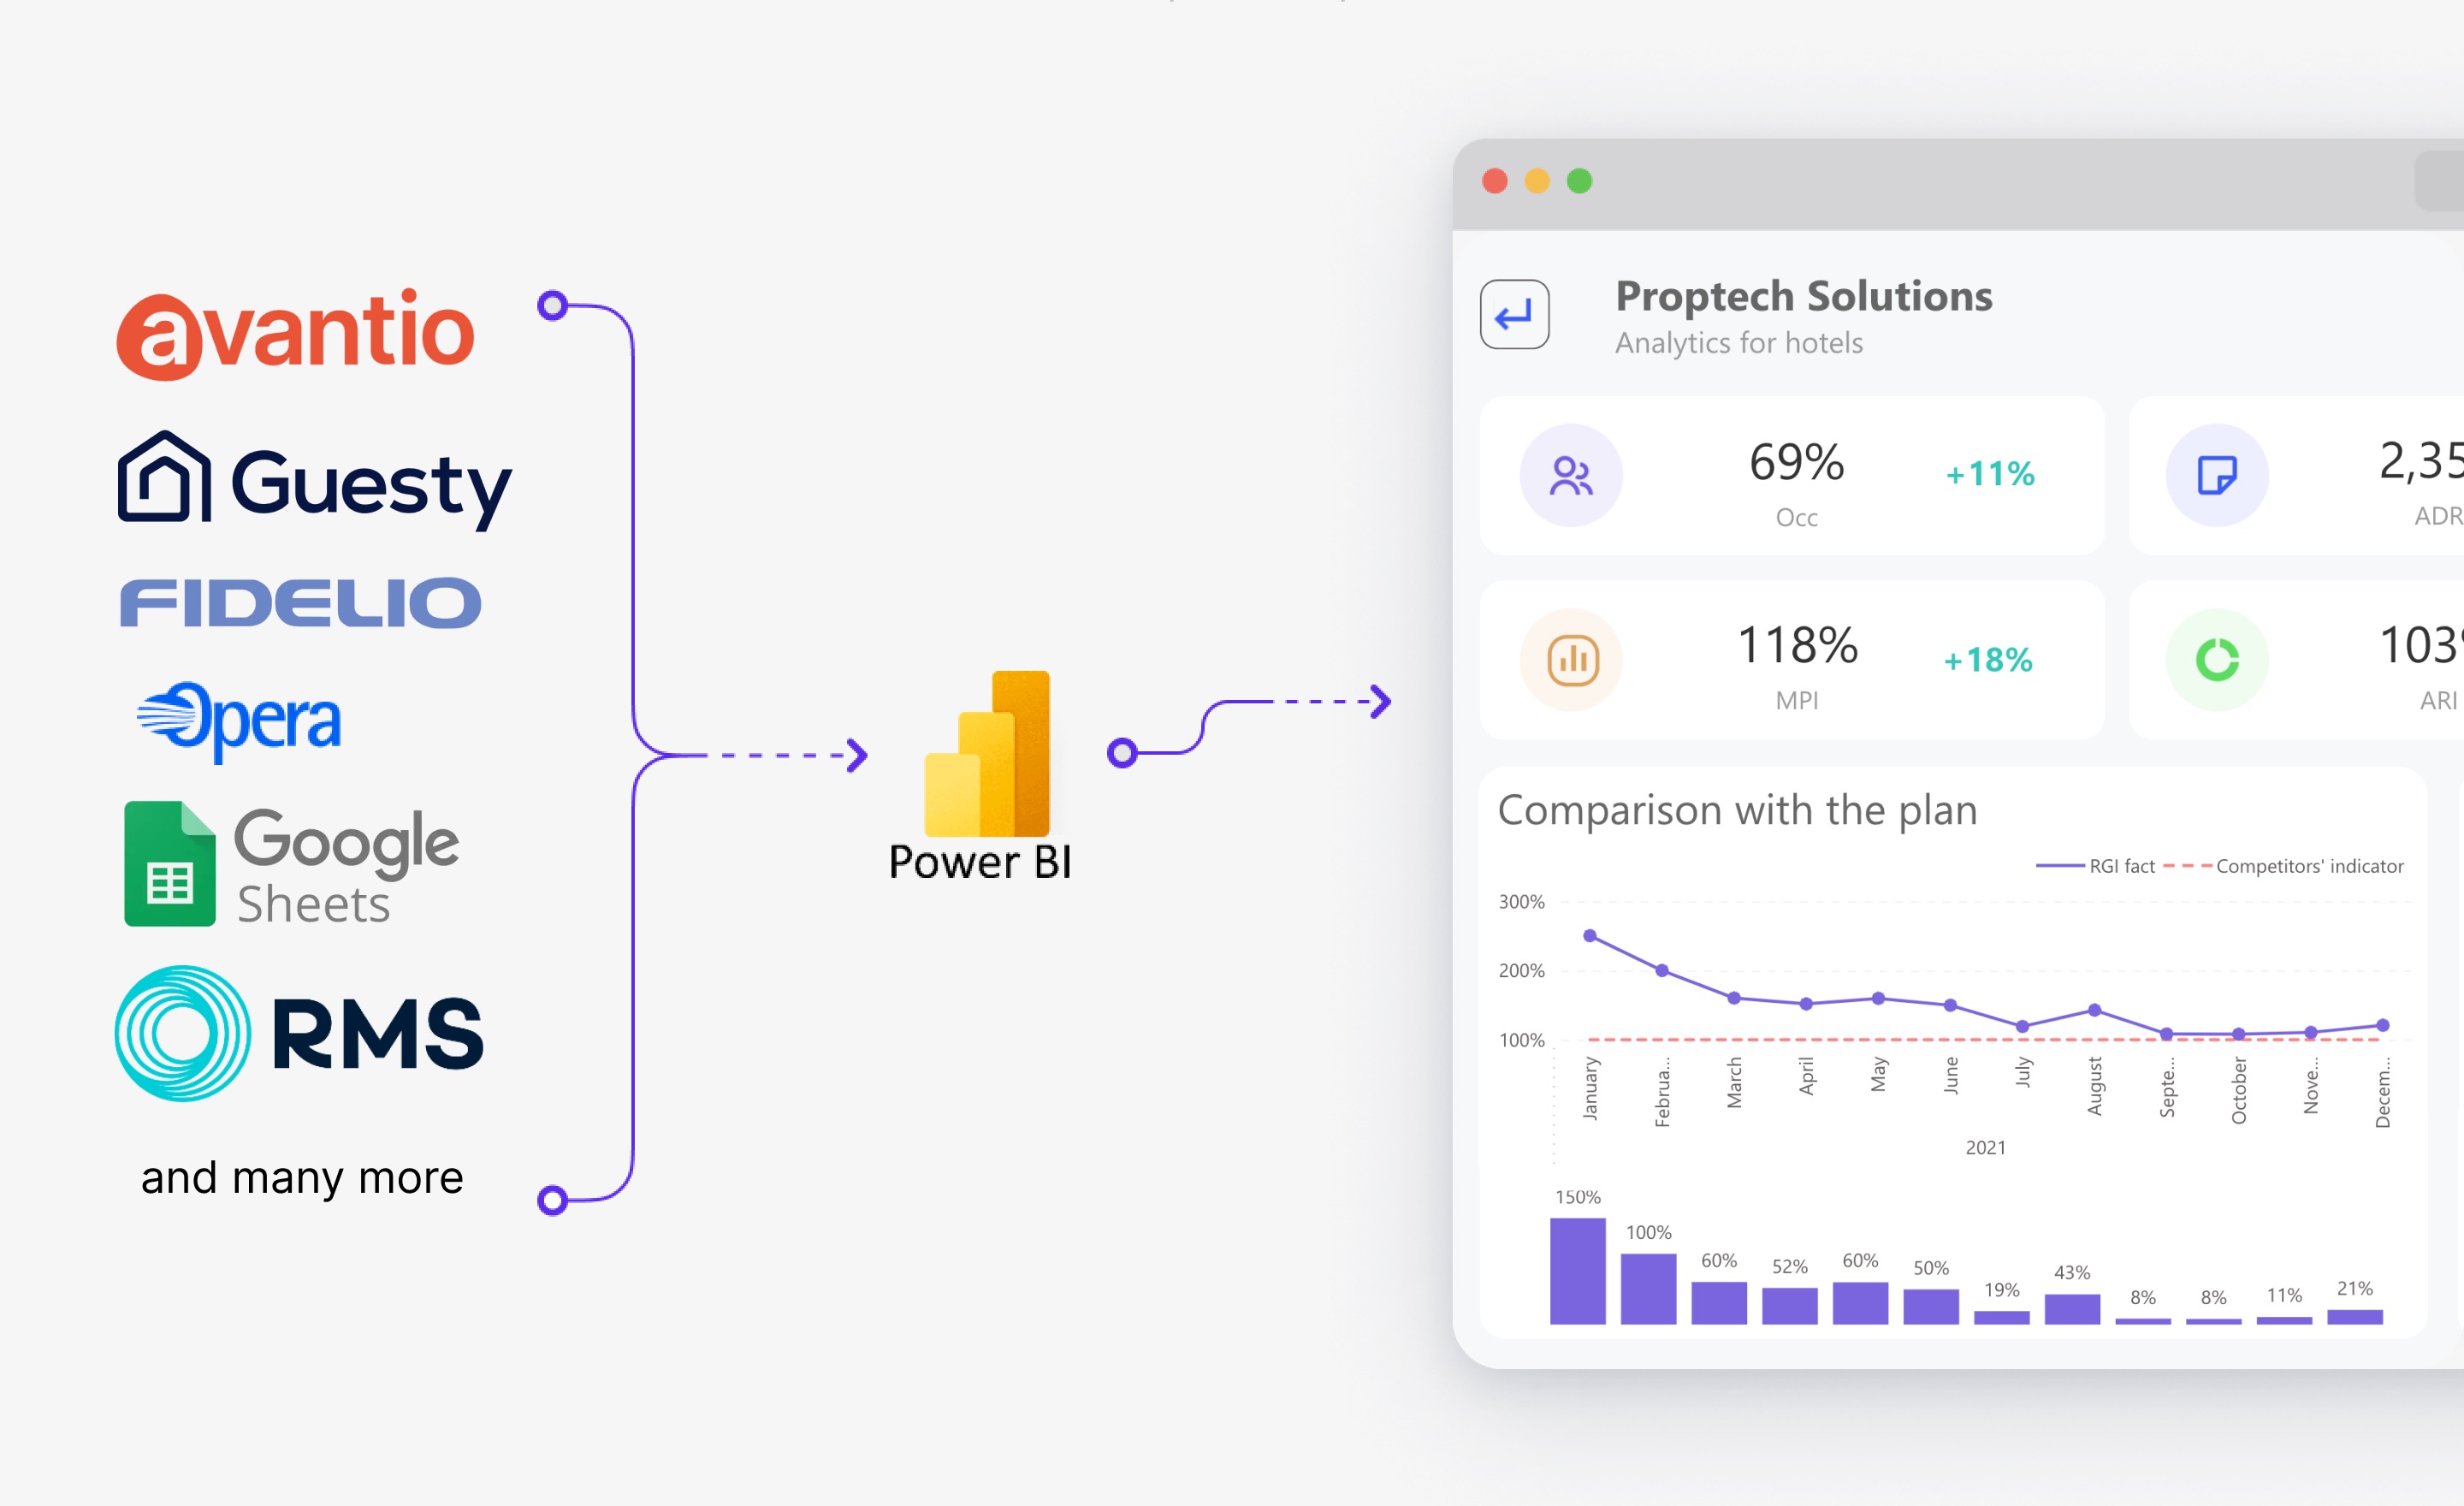
Business Analytics for Hotels
OCC – actual occupancy
ADR – average daily rate per room
RevPAR – revenue per available room per day
MPI – occupancy efficiency compared to competitors
ARI – average rate index compared to competitors' rates
RGI – revenue generated index compared to competitors
Didn't Find a Ready-Made Solution?
Contact our analyst, and we will offer you the optimal solution to your task.

Data Security
We make every effort to ensure the confidentiality and protection of data.

Before starting work, we sign an NDA guaranteeing the confidentiality of the processed data.

Data is collected automatically and stored on secured servers

Analytical reports can be accessed via an encrypted link or using an authorization system.


Frequently Asked Questions
What is business analytics?

Business analytics helps gain valuable insights and make strategic decisions. Business analytics tools analyze retrospective and current data, presenting results in intuitive visual formats like dashboards, charts, and diagrams.
Why Power BI?
Microsoft has created the best system for data analytics, a leading platform in every sense, from functionality to design capabilities and native usage. When experts talk about BI analytics, the first tool they recall is Power BI.
What indicators can be displayed on the dashboard?
The dashboard can display various indicators tailored to your needs and goals. We also offer a set of ready-made solutions that can be used without the need for development from scratch.
From which devices can I access?
The Power BI model is accessible on any internet-connected device, including laptops, computers, smartphones, and tablets, regardless of the operating system.
Do I need to download anything to view the report?
The BI model can be opened in a browser using an encrypted individual link or authorization with a login and password. Downloading software and/or registration is not required.
How often is the report updated?
Data is automatically updated according to a schedule agreed with the customer, up to eight times a day.
What sources are suitable for building the model?
Almost any. Power BI has over 270 connectivity tools for various data sources. We offer more than 35 ready-made integrations with popular CRMs, advertising cabinets, and accounting systems.
Can I make edits and adjust the model during support?
Yes, within the scope of support, you can make edits and adjust the model. We provide support for the current version of the model and promptly correct any malfunctions. If you need to add new functionality, we will assess the effort required and provide additional information.